Load the Audio Data#
In this example we will load and plot RedVox Audio data using DataWindow.
What is DataWindow?
The module DataWindow
in the RedVox Python SDK is designed to load both raw API RedVox data
and already created DataWindows (such as dw_1648830257000498_2.pkl.lz4)
downloaded from a RedVox Report.
Please visit DataWindow Examples for a tutorial on DataWindow.
NOTE: This example (and the following ones) use the already created DataWindow downloaded from a RedVox report. If your starting point is raw RedVox data, visit creating a DataWindow, or check out the Creating a Datawindow example.
Running the example#
Let’s start by loading the DataWindow from a RedVox report:
from redvox.common.data_window import DataWindow

# Input Directory
input_dir = "path/to/redvox/data/dw_1648830257000498_2.pkl.lz4"

# Load data window from report
dw = DataWindow.deserialize(input_dir)
The DataWindow contains Stations (devices that can record data, for example, a phone) which in turn contains the audio data for that Station.
Let’s extract the audio data for all the Stations in the DataWindow we loaded.
from redvox.common.data_window import DataWindow

# Input Directory
input_dir = "path/to/redvox/data/dw_1648830257000498_2.pkl.lz4"

# Load data window from report
dw = DataWindow.deserialize(input_dir)

# Loop to extract Audio data from all stations
for station in dw.stations():
    # Get audio data
    audio_samples = station.audio_sensor().get_microphone_data()
    audio_time_micros = station.audio_sensor().data_timestamps() - station.audio_sensor().first_data_timestamp()
    audio_time_s = audio_time_micros*1E-6  # from microseconds to seconds
Let’s plot the audio data by using the Matplotlib library.
from redvox.common.data_window import DataWindow
import matplotlib.pyplot as plt
# Input Directory
input_dir = "path/to/redvox/data/dw_1648830257000498_2.pkl.lz4"
# Load data window from report
dw = DataWindow.deserialize(input_dir)
for station in dw.stations():
# Get audio data
audio_samples = station.audio_sensor().get_microphone_data()
audio_time_micros = station.audio_sensor().data_timestamps() - station.audio_sensor().first_data_timestamp()
audio_time_s = audio_time_micros*1E-6 # from microseconds to seconds
# Plot Audio data for each station
plt.figure()
plt.plot(audio_time_s, audio_samples)
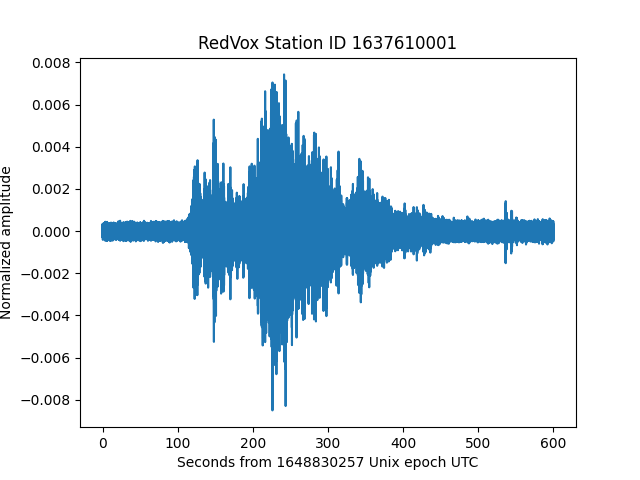
plt.title(f"RedVox Station ID {station.id()}")
plt.xlabel(f"Seconds from {int(dw.start_date()*1E-6)} Unix epoch UTC")
plt.ylabel("Mic amplitude (unity at full range)")
plt.show()
Example output#
When you run the above snippet of code, you should see this graph:
For a more complete example on how to load audio data, visit the Github sample code.
Great! We can now take a look on how to load other sensors such as the accelerometer.