2. Run the code#
Now that all the set-up is complete, you are ready to run the Skyfall example!
2.1. Introduction: skyfall_intro.py#
Run the file skyfall_intro.py (view in code in Github).
skyfall_intro.py extracts the API 900 RedVox data and plots Time-Domain Representation of the different sensors
available as the phone descended from the Stratosphere. A graph plotted in skyfall_intro.py is shown below.
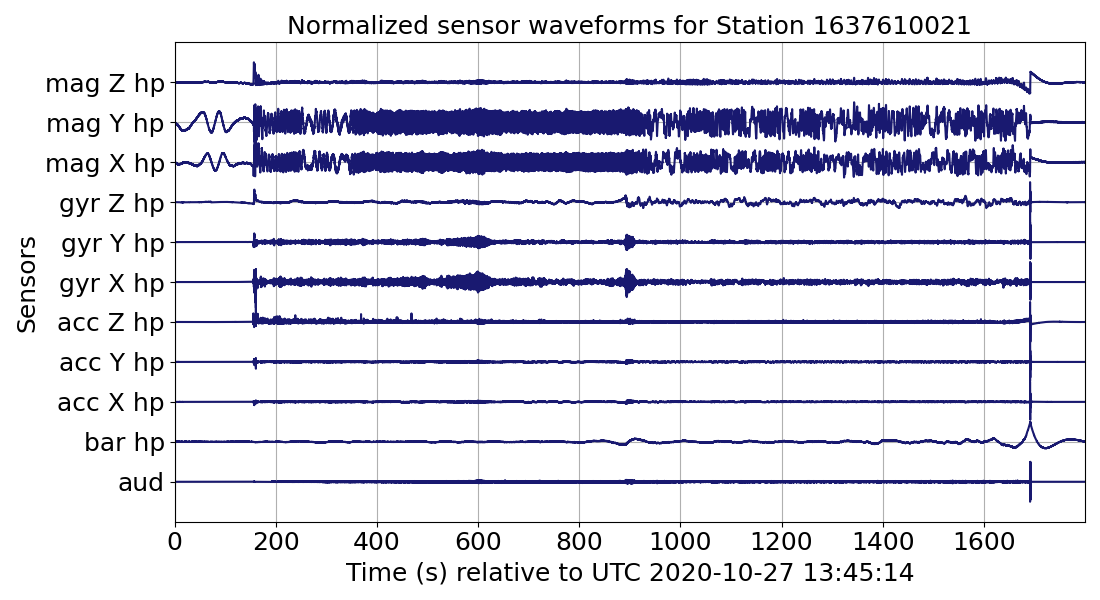
High-pass filtered (hp) waveforms for sensors: audio, barometer (Bar), accelerometer (Acc), gyroscope (Gyr), and magnetometer (Mag). X-Y-Z coordinates are shown vertical axes are normalized to the peak absolute magnitude of each channel. Figure 17. High-pass filtered (hp) waveforms for sensors: audio, barometer (Bar), accelerometer (Acc), gyroscope (Gyr), and magnetometer (Mag).#
2.2. More scripts#
The lib folder (view in Github) contains various scripts that examine different aspects of the data. In order:
run_all.py: run all the scripts in the lib folderskyfall_dw: create a RedVox DataWindow that is used to load the RedVox data inrun_all.pyskyfall_ensonify.py: ensonify the Skyfall dataset to a .wav file so you can listen to itskyfall_export.py: export the Skyfall dataset into a .parquet for later useskyfall_gravity.py: examine the accelerometer gravity waveformsskyfall_loc_rpd.py: extract the location data from the bounder to make a CSV (in the bounder folder)skyfall_spinning.py: examine the gyroscope to understand how the phone spun as it fellskyfall_station_specs.py: export station specs to CSVskyfall_tdr_rpd.py: plot Time-Domain Representations (run inskyfall_intro.py)skyfall_tfr_rpd.py: plot Time-Frequency Representations
An example of a spectrogram plotted in skyfall_tfr_rpd.py:
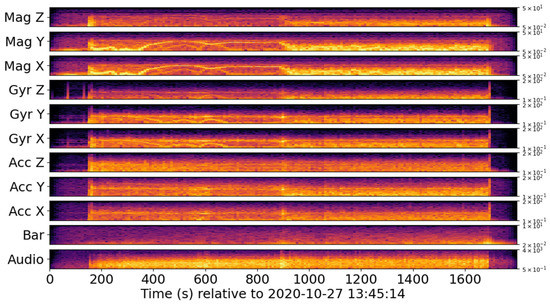
Short-term Fourier transforms of high-pass filtered (hp) waveforms for sensors: audio, barometer (Bar), accelerometer (Acc), gyroscope (Gyr), and magnetometer (Mag). The color scales barometer (Bar), accelerometer (Acc), gyroscope (Gyr), and magnetometer (Mag). The color scales to to the maximum amplitude. The vertical axes represent logarithmic frequency in hertz to the sensor the maximum amplitude.#
2.3. What to do next?#
Here are a few suggestions if you are interested in learning more about Skyfall and RedVox:
Read more about Skyfall in Skyfall: Signal Fusion from a Smartphone Falling from the Stratosphere.
Read more about the RedVox SDK used to load the RedVox phone data.
Read more about RedPandas used to process the RedVox data.